Metrics contained in the glossary of terms are based on my manually tracked data, or raw Wyscout data.
Metrics marked by ★ appear as part of the individual visuals, known as pizza charts.
Metrics marked by ☆ are considered as part of overall percentiles featured on pizza charts.
Both of these sets of metrics, weighted as per below, contribute to rankings featured on comparison visuals.
Some metrics, with no symbol, are only referred to as part of the various texts, without reflecting on charts.
This summer, I am also letting you in on the weight applied to the particular metric when it comes to producing an overall percentile for the position. With a much wider range of metrics now considered following the adoption of the vast Driblab database, it has become more important than ever to note that not all metrics are created equal; ie. considered equally vital when comparing the players. If there is a “Weight” missing, it means the metric has a purely informative value and was not used to “judge” the player.
(I) DEFENSIVE RELIABILITY
VITAL DEFENSIVE CONTRIBUTIONS
Source: Manually tracked
Weight: 100%
Instead of relying on Wyscout's clearances (sometimes bizarrely tagged deep into the attacking half) or vague "successful defensive actions", I rely on my own set of eyes and track truly vital defensive actions by myself. For this metric, I combine interceptions, clearances and backtracking actions that actually prevent danger (ie. occur in a situation when, say, pass is directed to opponent's feet in a final third or thereabouts, not just anywhere). It is not just about racking up these, though, otherwise the top of the leaderboard would just be full of bottom-feeders; it's about the balance. Hence, the player in question is punished whenever he mistimes a jump, botches a clearance, only half-intercepts a situation, miscommunicates, or blatantly ignores his backtracking duties.
DEFENDING THE CHANNEL 1-ON-1
Source: Wyscout.hudl.com
Weight: 100%
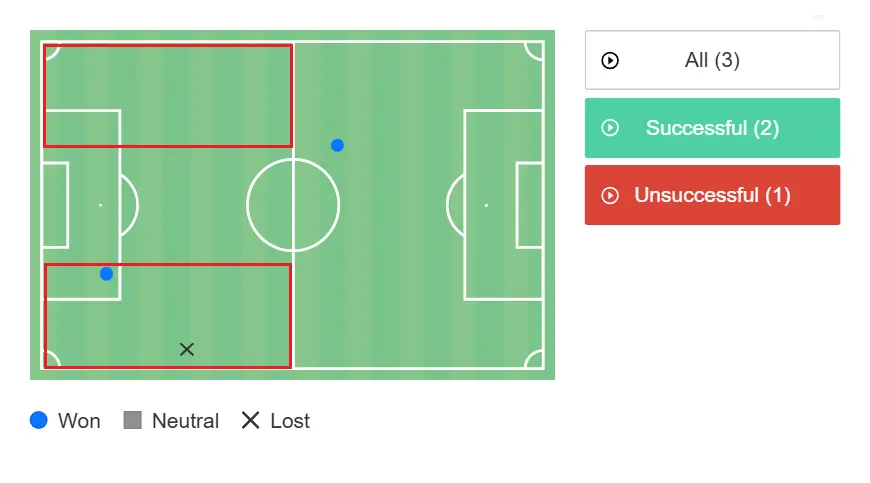
A metric designed to filter out noise that doesn't matter, I am concerned purely with ground duel success rate down both channels, stretching all the way to the half-line. Specifically, these areas.
TENDENCY TO SWITCH OFF ON DEFENCE
Source: Manually tracked
Weight: 100%
This is where I bash the player for any time he was caught sleeping; specifically whenever he caused a goal or a major chance via poor positioning, loose marking or lacking gap control (not applying pressure on a shooter/passer soon or urgently enough); a special co-efficient is applied on top of this to account for goal-causing errors. To be clear, I am no seasoned coach or even a tactics experts, so I might be off on a lot of these situation, but across the full season, I'd argue it evens out.
DEFENSIVE AERIAL DUELS
Source: Driblab
Weight: 100%
Previously, I didn't consider aerials at all for fullbacks, but then Slavia changed my mind. Courtesy of Driblab database that allows for this distinction, I am only looking at defensive aerials, though.
TACKLES/WAS DRIBBLED
Source: Driblab
Weight: 100%
For years, I have stubbornly ignored Wyscout's "possession-adjusted tackles" metric since it only looked at one side of the coin. Enter Driblab, who bring us this metric, comparing the amount of tackles to the number of times the player was dribbled past (Virgil Van Dijk would never!).
FOULS IN DEFENSIVE THIRD
Source: Wyscout.hudl.com
Weight: 100%
Pretty straightforward; with an added co-efficient applied to bring out penalty fouls.
CRUCIAL BACKSTOPPING ACTIONS
Source: Wyscout.hudl.com / manually tracked (for goal-preventing backstopping actions)
Weight: 75%
Every now and then, if it's a major aspect of one's game especially, I might refer to these backstopping actions that are actually all blocks (as registered by Wyscout) weighted against last-ditch blocks, interceptions or clearances that basically prevented a clear goal. These are rare, by the way — as opposed to just any danger-preventing backstopping actions included elsewhere.
BLOCKED CROSSES
Source: Wyscout.hudl.com
Weight: 50%
Not to be confused with the % of blocked crosses, here the fullback acts as the preventer of danger.
BLAME SHARE FOR GOALS CONCEDED
Source: Manually tracked
I assign up to 4 goal-allowing slots to any goal conceded across the season. There is one slot reserved for a grave fuck-up and three extra ones for more run-of-the-mill mistakes like losing a key aerial/ground duel, getting peeled off by a ball carrier, etc. This metric then speaks to how big a percentage of goals the fullback "caused" — only accounting for goals against he's on the pitch for.
IMPLICATED IN DANGER ALLOWED
Source: Manually tracked
See "Blame share for goals conceded" and extend it to missed opportunities, as well.
(II) POSITIONAL SENSE & AGILITY
SUCCESSFUL LOOSE BALL DUELS
Source: Wyscout.hudl.com
Weight: 100%
As opposed to elsewhere, I am not too concerned with the success rate here; I simply want to see how many races — shoves and pulls — for a free ball in no one's possession the player in question successfully navigates per game. That helps us to illustrate one's agility at the very least.
PRESSURE APPLIED UP HIGH
Source: Wyscout.hudl.com / manually tracked (forced high turnovers leading to tangible danger)
Weight: 100%
A standard feature: I take balls recovered in the final third (Wyscout) and add a weighted cherry on top in the form of forced turnovers leading to goals/chances. This add a bit of a purposeful touch.
OFF-BALL RUNS TO RECEIVE CROSS
Source: Driblab
Weight: 100%
A decent, proactive fullback not only delivers the ball to the penalty box, he's also sometimes there to sweep it up. That's what this metric is designed to capture, looking at how often the player enters the box in a position to receive a teammate's cross. Whether he gets to finish or not is secondary.
POSSESSION-ADJUSTED INTERCEPTIONS
Source: Wyscout.hudl.com
Weight: 100%
Interceptions alone don’t tell the full story — if your team dominates possession, you barely get the chance to make any. Wyscout fixes that by normalizing for context: they assume every team spends an equal 30 minutes per game out of possession (based on a 60-minute average of actual ball-in-play time). That way, players from possession-heavy teams aren’t punished for simply doing their job — which is how guys like Sonne or Preciado still manage to land in the 80th+ percentile.
SUCCESS IN HIGH OFFENSIVE DUELS
Source: Wyscout.hudl.com / manually tracked (duels/fouls and dribbles leading to tangible danger)
Weight: 100%
Here, too, the emphasis is placed on the amount of offensive duels successfuly navigated in the final third (broadly) rather than success rate, to also capture one's proactivity; with an additional co-efficient applied to reward tangible danger (goals/chances) created via dribbles or duels/fouls won.
BYPASSED BY ACTIONS
Source: Driblab
Weight: 100%
Anytime the fullback is bypassed via a passing play or a ball carry, he gets tagged. Simple as.
ACCELERATIONS
Source: Wyscout.hudl.com
Weight: 50%
This stat captures meaningful ball-carrying surges — defined as runs of at least 10 meters featuring a notable increase in speed. Only actions in possession count — pure off‑ball sprints do not.
PASSES RECEIVED IN OPEN SPACE
Source: Driblab
Weight: 50%
A decent fullback knows how to find pockets of free space. Sure, it depends on whether he's surrounded by capable distributors, but still, "pass receipts completed in the attacking half with no defender in a 5 meter radius towards the direction of the goal" still matter to be monitored.
OVERLAPS & UNDERLAPS
Source: Driblab
Weight: 50%
Movement where the player gets around a teammate in possession, from the inside or the outside.
DISTANCE TRAVELLED AT HIGH SPEED OR IN SPRINT
Source: Driblab
Weight: 25%
I don't think a player running fast for long is necessarily a good sign of anything, but it's trendy, so here you have it at the minimal weight. I specifically look at the percentage of time spent travelling at high speed or in sprint (above 19.8 km/h). The portions range from 7.2% to 11.9%, so I thought it's substantial enough to include it. And no, team style of play doesn't fully dictate the outcome (e.g. Jablonec FBs rank low, but Sparta FBs do not, even as both are known for slowing things down).
(III) ATTACKING RANGE & SMARTS
PERCENTAGE OF CROSSES BLOCKED EARLY
Source: Wyscout.hudl.com
Weight: 100%
Even in the inverted wingback era, crossing remains a big part of one fullback’s game which is why most public models or databases include crossing accuracy. I myself had considered “accurate crosses to centre of the box” in 2021, but I quickly dropped it as a metric, and I’ll explain why: it’s too random. Is it necessarily the fullback’s fault when he delivers the ball into the danger area only for no one else to take a hint and make the run? It quite often is not. Is it, however, the fullback’s fault when his delivery gets blocked before it even enters the penalty area, potentially kick-starting a dangerous counter? It rather often is, yeah. So that’s what I’m looking at here. I don’t care if your cross doesn’t quite connect as long as it can feasibly lead to a lucky bounce or even an own goal in the end.
SUCCESS RATE IN ENTERING THE BOX
Source: Wyscout.hudl.com
Weight: 100%
When entering the box from open play, a fullback in particular should think a little, since they normally have vast acres of space to utilize. While the similar metric speaking to the no. of successful entries inherently favours players on big teams, enjoying loads of possession, this one does not.
CUTBACKS
Source: Driblab
Weight: 100%
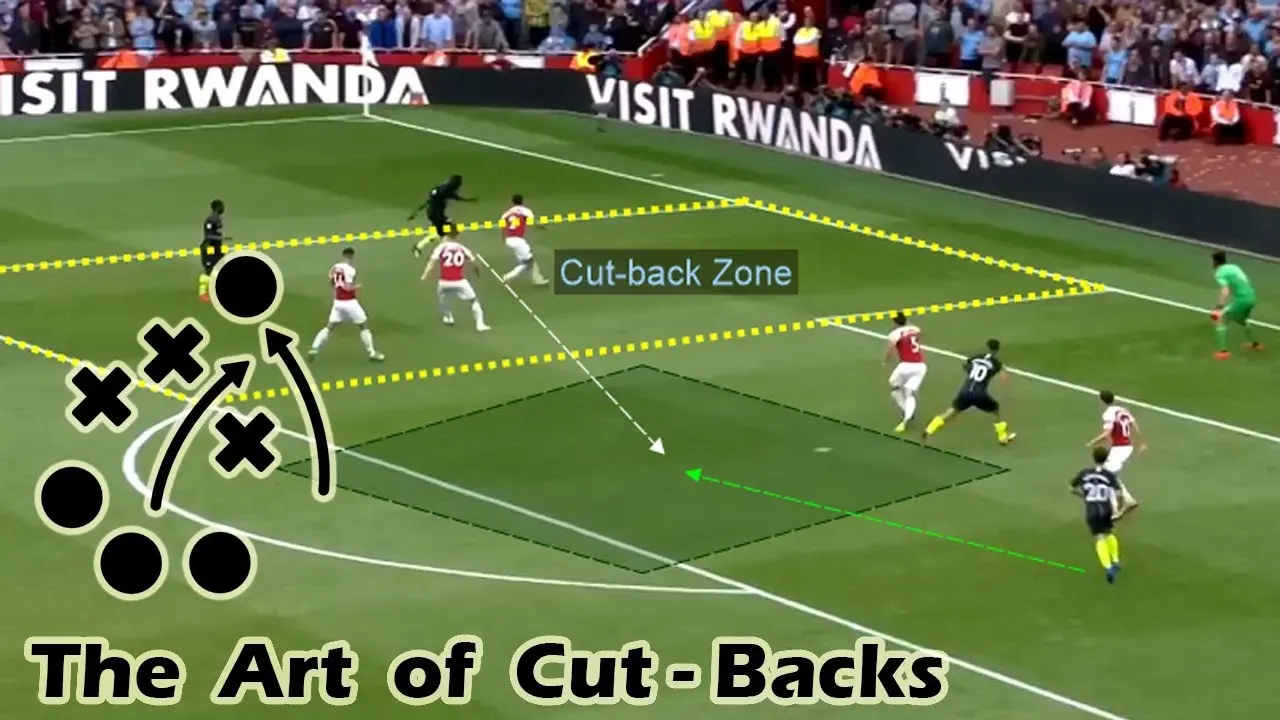
Effectively forming one part of a half-space, the so-called “cutback zone” is another noted danger area of the pitch where you’d ideally want your modern fullback to function and cause damage. I used to track these myself from Wyscout tags, now I leverage on the ready-made Driblab metric.
LINE-BREAKING THROUGH BALLS
Source: Driblab
Weight: 100%
Switching from Wyscout to Driblab, I'm still interested in passes that penetrate the defensive line.
HORIZONTAL STRETCH PASSES
Source: Wyscout.hudl.com
Weight: 50%
Previously I had horizontal and vertical passes grouped together. Now I separate them to also differentiate the level of impact through the different weighting. Through balls, on average, move the needle far more often, while horizontal passing is more expected from players on strong teams.
(IV) BUILD-UP CONTRIBUTION & THREAT
OPEN-PLAY PENALTY BOX ENTRIES
Source: Wyscout.hudl.com
Weight: 100%
The number of times, normalized per 90 mins, a player enters the opposition’s penalty area in open play — via a carry, a cross, or a pass. It discounts set pieces for the sake of fair comparison.
METERS GAINED VIA BALL CARRIES
Source: Wyscout.hudl.com
Weight: 100%
This metric, normalized per 90 mins, measures how many meters a player advances the ball through successful carries, excluding passes. It calculates the difference in distance to the opponent's goal between the start and end point of a run or dribble, counting only forward movements.
METERS GAINED VIA PASSING PLAY
Source: Wyscout.hudl.com
Weight: 100%
This metric quantifies how much ground a player advances the ball through their passing, measuring the forward distance (toward the opponent’s goal) between the start and end points of each completed pass. It doesn't account for any lateral/backward movement, as per common sense.
NET EXPECTED THREAT
Source: Driblab
Weight: 100%
Per Driblab's own glossary, "Expected Threat (xT) is a metric that measures the threat a player creates to the opponent by carrying or passing the ball to areas where the possession's probability of ending in a goal is higher". At the same time, Driblab also tracks how the player allows dangerous areas to be penetrated at the other end, which is exactly where the "net" aspect comes in play.
NON-PENALTY EXPECTED GOALS
Source: Wyscout.hudl.com
Weight: 100%
While with centre backs, this stat mostly boils down to "who's the biggest set piece alfa", with fullbacks it is often far more about the ability to close down the opponent's penalty box.
OPEN-PLAY DANGER CREATED
Source: Manually tracked
Weight: 100%
My own alternative to Wyscout's flawed xG/A, where I don't care for unfinished business. As long as the player delivers the ball to a dangerous position, onto his teammate's feet, he gets credited regardless of the outcome. Sometimes, if the teammate doesn't time his slide properly or wildly miscontrols the ball, the "on his teammate's feet" caveat doesn't apply, either. And with the exception of goals, the player can also be credited for creating danger for himself. As opposed to xA, I also disregard set piece delivery to make sure the comparison is fair and indeed feasible.
INVOLVED IN ATTACKING OUTPUT
Source: Manually tracked
Weight: 75%
My full-season notes include any tangible danger created by a team — be it a goal scored (with 1 slot for the official assist, up to 3 slots for any other meaningful contribution in the build-up), or a goalscoring opportunity wasted (up to 2 chance-creating slots). As long as the player features as a creator or a finisher, he's considered involved. In the end, I take the % and see who was most active.
OPEN-PLAY EXPECTED ASSISTS
Source: Driblab
Weight: 75%
Switching from Wyscout to Driblab to isolate open play. Mind that xA value is only assigned to a pass/cross that directly precedes a shot; any sort of a partial touch from the opponent along the way, or even a longer dribble/run with the ball from the finisher, normally leads to no xA.
NET VALUE ADDED
Source: Manually tracked
Weight: 50%
Via all goals and only meaningful assists (ie. not just balls handed over to the lucky/sharp shooter at the edge of the box). For 2025/26, I am also crediting any indirect goal contribution (at a lesser weight), while setting back the player for any goal-causing (grave) error which also carries its own value. Here's full explanation of the innovative model, initially introduced by the tremendous CSfotbal. And here's the final leaderboard for 2025/26 (featuring not too many fullbacks, duh).
XG BUILD-UP CONTRIBUTION
Source: Driblab
Weight: 50%
Driblab is much more playful with xG than Wyscout. Here I am leveraging on their metric that takes into account the player's contribution in the build-up where both the shooter and the one who set him up are excluded. Unsurprisingly, fullbacks of Slavia and Sparta rank the highest through the sheer amount of xG generated, but there are still intriguing appearances up and down the ladder.