Metrics contained in the glossary of terms are based on my manually tracked data, or raw Wyscout data.
Metrics marked by ★ appear as part of the individual visuals, known as pizza charts.
Metrics marked by ☆ are considered as part of overall percentiles featured on pizza charts.
Both of these sets of metrics, weighted as per below, contribute to rankings featured on comparison visuals.
Some metrics, with no symbol, are only referred to as part of the various texts, without reflecting on charts.
This summer, I am also letting you in on the weight applied to the particular metric when it comes to producing an overall percentile for the position. With a much wider range of metrics now considered following the adoption of the vast Driblab database, it has become more important than ever to note that not all metrics are created equal; ie. considered equally vital when comparing the players. If there is a “Weight” missing, it means the metric has a purely informative value and was not used to “judge” the player.
(I) ATTACKING THE BOX
OFFENSIVE DUELS WON UP HIGH (%)
Source: Wyscout.hudl.com / manually tracked (for danger-creating actions via battles and dribbles)
Weight: 100%
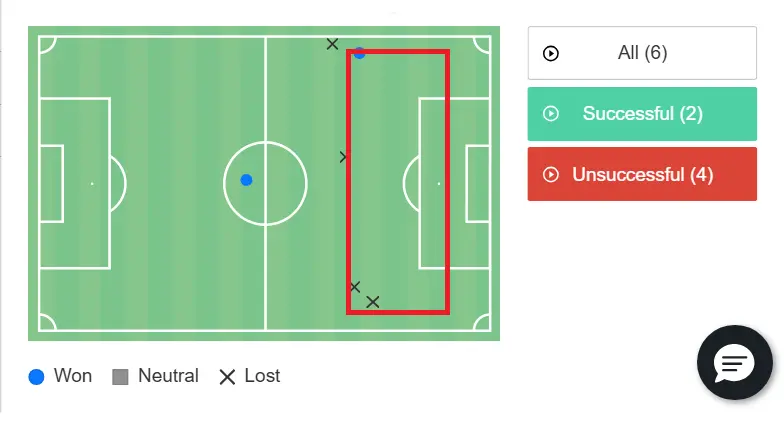
Here, I am severely limiting the space where an offensive duel needs to occur for it to count. It roughly corresponds to this area, and for two main reasons. Firstly, the relevant grouping of metrics is called "attacking the box" and as opposed to others, this stat is supposed to capture the "entering" phase rather than what happens in the box. Secondly, this area is both crowded enough and close enough to goal to allow for meaningful, skill-based impact. In contrast, duels deep inside the box often hinge on split-second reactions or blind adjustments, which I find less indicative of actual quality. That’s a sweeping generalization, of course — so to balance it out, I award bonus points for duels or dribbles that directly lead to a goal or big chance, regardless of where they happen.
OPEN-PLAY PENALTY BOX ENTRIES
Source: Wyscout.hudl.com
Weight: 100%
The number of times, normalized per 90 mins, a player enters the opposition’s penalty area during open play — via a carry, a cross, or a pass. It discounts set pieces to be fair. A co-efficient favouring those who utilize give-and-goes, dummies and other tricks for danger created is applied on top.
DEEP PASSING AND CROSSING
Source: Wyscout.hudl.com
Weight: 100%
This is actually a combination of three Wyscout metrics, ha! The database tracks passes and crosses separately, whereas for centre forwards specifically, I don't care whether they connect inside this area one way or another; that they do connect at all is most important. It's also notable that a deep pass/cross can be one that enters the area, and one that begins and concludes its journey within it. That's quite neat because the stat doesn't discriminate against either a traditional target man (who mostly knocks balls down for teammates inside the box, Jan Koller style) or a lower-sitting operator who's more helpful in entering the box instead. To add a bit more flavour on top, a co-efficient accounting for accurate smart passes ("a creative and penetrative pass that attempts to break the opposition's defensive lines to gain a significant advantage in attack" per Wyscout) is applied.
SUCCESSFUL ACTIONS IN PENALTY BOX (%)
Source: Wyscout.hudl.com
Weight: 100%
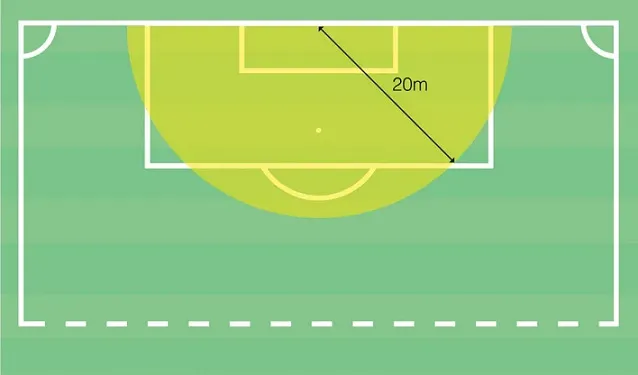
This is basically any successful execution — be it a pass, a cross or a shot (only those directed on target count as successful); excluding ground duels, aerial duels or fouls. I’ve opted for success rate to not disadvantage those who — not just through their own doing, or lack there of — don’t get to influence the game from inside the box too often. This is my way of utilizing the "touch in the box" stat, btw, often referred to just like that — even if touching the ball in the box alone barely matters.
EXPECTED ASSISTS
Source: Wyscout.hudl.com (heavily corrected via manual tracking)
Weight: 100%
Wyscout's measure of threat generated, inclusive of set pieces. Mind that xA value is only assigned to a pass/cross that directly precedes a shot; any sort of a partial touch from the opponent along the way, or even a longer dribble/run with the ball from the finisher, normally leads to no xA.
XG BUILD-UP CONTRIBUTION IN FINAL THIRD
Source: Driblab
Weight: 75%
Driblab is beautifully playful with xG. Here I am leveraging on their metric that speaks to a sum of xG the player in question took part in, inside the final third, but excluding shooter and final passer.
SUCCESS RATE IN ENTERING THE BOX
Source: Wyscout.hudl.com
Weight: 75%
When entering the box from open play, an attacker should think a little, finding clever ways to break through in the notoriously crowded areas. While the metric speaking to the number of successful entries inherently favours players on big teams, enjoying loads of possession, this one does not.
PASS RECEIPTS IN SPACE INSIDE FINAL THIRD
Source: Driblab
Weight: 50%
A cunning operator at centre forward is also able to find space in the final third where he's left unmarked for a few seconds, and do so more often than others. Of course, having skilful passers behind you helps here, but it's not a stat as dependent on teammates as you might think.
OFF-BALL RUNS TO RECEIVE CROSS
Source: Driblab
Weight: 50%
While many drop deep these days, centre forwards ultimately needs to be a threat in the box. That's what this metric is designed to capture, looking at how often the player enters the box in a position to receive a teammate's cross. Whether he actually gets to finish or not is secondary here.
(II) TRADITIONAL POACHING
NON-PENALTY EXPECTED GOALS INSIDE THE BOX
Source: Wyscout.hudl.com (heavily corrected through manual tracking)
Weight: 100%
Previously, I had a metric specifically tracking "hopeful", long-range shots taken from outside the box. Now I'm just happy with this one accounting for shots taken from inside the box only. It's little else than cosmetics, since most outside-the-box attempts fall within the 0.01-0.05 xG range and also most CFs still source upwards of 90% of their individual xG from inside the box (only two, Kozák and Rrahmani, went below 80% in 24/25), but I find it a key interpretive lens anyway. Whatever your style, the 18-yard box is ultimately where you want your striker to try his luck above all.
QUALITY ADDED TO FINISH
Source: Wyscout.hudl.com (heavily corrected through manual tracking)
Weight: 100%
Most data analysts would tell you finishing is too random to be worth spending much time — or any time — on dissecting it. It’s tempting to agree, since the very reason why Plzeň won the shocking 2022 title was all the same a big reason why Plzeň bombed the year earlier. Per this metric, Jean-David Beauguel made for the 8th best finisher in the title-winning 2022/23, a wild swing from being the 11th worst the year before when he missed the second most high-danger chances. It’s exactly for this unpredictability and virtual impossibility to detect any longterm trends that most data analysts readily give up on sizing up finishing ability altogether. I refuse. First of all, this particular metric still tells us a valuable thing or two even if we shouldn’t read too much into it. If your individual sum of xGS (expected goals scored; ie. post-shot xG) far exceeds the sum of xG (expected goals; ie. pre-shot xG) it can effectively mean two things: the striker in question A) has a fine shooting technique so his shots tend to have a decent chance of beating the keeper, be it through sheer power applied or fantastic placement B) doesn’t miss the target all too often, because a shot off target doesn’t get assigned any xGS value. There are absolutely trends to be found along this line of thinking in particular, and you'd be surprised how consistently poor/great some appear to be per this metric.
HIGH-DANGER SHOTS PUT OFF TARGET
Source: Wyscout.hudl.com (heavily corrected through manual tracking)
Weight: 100%
After initially considering any shot worth at least 0.2 xG a "high-danger" one, I lowered the bar to 0.15 in 2024 and I think I am sticking to it. This is based on vast experience of reviewing every shot tag since 2022, and while an arbitrary cut-off will never be perfect (0.14-xG shots are still very dangerous), I'm also confident in calling every 0.15+ xG shot a genuine goalscoring opportunity, and so anytime you don't threaten the goalkeeper from such a position (ie. blocked goalbound shot is fine here), you fail your team. Again, while a small sample can easily trick you (some regulars only get to finish off 5-7 high-danger shots, so even one miss trips them up greatly), eye test mostly concurs.
HIGH-DANGER SHOTS
Source: Wyscout.hudl.com (heavily corrected through manual tracking)
Weight: 50%
Previously I only looked at the percentage of whiffed high-danger shots, to not gravely penalize players on lesser teams with fewer opportunities, but now — at an appropriate weight — I am adding this one here, too. Remember that a "high-danger shot" carries the value of at least 0.15 xG.
AVERAGE SHOT DISTANCE
Source: Driblab
Weight: 25%
While Wyscout only tracks this for the whole teams, Driblab also does individuals. And since the category is called "poaching", it was very hard to resist this one here. Like a kid in a candy store.
XG FROM HEAD SHOTS
Source: Driblab
Just out of interest, I may sometimes leverage on Driblab's distinction of how xG is generated.
BIG CHANCE RATIO
Source: Wyscout.hudl.com
Also out of curiosity, I might occasionally take a look at how big a portion of all shots is taken up by properly big chances (of at least 0.3 xG value) for the particular striker. Only extremes are worth it.
SHOT STREAK
Source: Wyscout.hudl.com
On a rare occasion, and only in the extreme, I might refer to a player putting together a particularly long/short uninterrupted series of non-penalty shots placed off target. This is really a "just in case" stat, since the 25/26 extreme is 6 in the case of two centre forwards (while the average is around 3), but it's also worth noting that someone like Kabongo never went back-to-back with his attempts.
(III) TARGET MAN & DEEP-LYING EFFORT
DANGER CREATED FOR TEAMMATES
Source: Manually tracked
Weight: 100%
My own alternative to Wyscout's flawed xG/A, where I don't care for unfinished business. As long as the player delivers the ball to a dangerous position, onto his teammate's feet, he gets credited regardless of the outcome. Sometimes, if the teammate doesn't time his slide properly or wildly miscontrols the ball, the "on his teammate's feet" caveat doesn't apply, either. You still created a situation which made the opposition sweat. As opposed to xA, I also disregard set piece delivery.
OFFENSIVE AERIAL DUELS
Source: Driblab
Weight: 100%
Previously, I was tracking a player's success rate in aerial duels up top, in certain danger areas, and inside his own box through Wyscout. Now I switch to Driblab that crucially differentiates between offensive and defensive aerials, zeroing in on the former. I may still mention one's contribution in their own box, though, since it is still a big part of, say, Tomáš Chorý's charm (9 out of 10 duels won).
LINE-BREAKING ACTIONS
Source: Driblab
Weight: 100%
Number of passes and carries combined that successfully penetrate one or more defensive lines.
OPEN-PLAY EXPECTED THREAT
Source: Driblab
Weight: 100%
Per Driblab's own glossary, "Expected Threat (xT) is a metric that measures the threat a player creates to the opponent by carrying or passing the ball to areas where the possession's probability of ending in a goal is higher". We leave out set pieces entirely, even if they are not a huge factor for CFs.
PASS COMPLETION UNDER STRONG PRESSURE
Source: Driblab
Weight: 100%
Previously I was looking at back passes and their accuracy, improvizing heavily and far beyond my comfort zone while trying to utilize the limited Wyscout database. Now Driblab makes my job much easier, looking at pass completion when the opponent is 0-2 meters away from the centre forward.
BALL PROGRESSION INSIDE THE FINAL THIRD
Source: Driblab
Weight: 100%
Number of times the player advances 10 or more meters either by passing, by carrying the ball or a combination of both. In the case of CF, the progression needs to occur in the final third specifically.
ACTUAL PASS COMPLETION VS EXPECTED
Source: Driblab
Weight: 75%
Here I compare two separate Driblab values: the traditional pass accuracy against the expected pass completion. Normally, you'd want to be anywhere above break even, with CFs it's more about how far they lag behind the expected % (between 17.5% and 1.6%, so great variety). Here's more on the logic.
CUTBACKS
Source: Driblab
Weight: 50%
Previously only considering this metric for CFs, now I am including it for Ws too, better capturing their full range of tools. Driblab defines this as "passing from baseline to back and inside the box".
BALL RETENTION INSIDE ATTACKING HALF
Source: Driblab
Weight: 50%
A quality target man is as much about helping the team to get into the box as he is about (at the very least) keeping it in play for them. You can't keep losing possession, or else you tire the team.
EXPECTED THREAT VIA PASSING
Source: Driblab
Weight: 25%
This is the Driblab staple metric, but only accounting for passing plays.
ACCELERATIONS
Source: Wyscout.hudl.com
Weight: 25%
This stat captures meaningful ball-carrying surges — defined as runs of at least 10 meters featuring a notable increase in speed. Only actions in possession count — pure off‑ball sprints do not.
(IV) PROACTIVITY & DISCIPLINE
FOUL DIFFERENTIAL
Source: Wyscout.hudl.com
Weight: 100%
Not just a simple fouls won minus fouls conceded, but also normalized per 90 mins, because being a minus-12 in 10 starts obviously isn't the same as being a minus-12 in 30. The former stinks more.
OFFSIDES
Source: Wyscout.hudl.com
Weight: 100%
Self-explanatory, also normalized per 90 minutes.
PRESSURE APPLIED UP HIGH
Source: Wyscout.hudl.com / manually tracked (forced high turnovers leading to tangible danger)
Weight: 100%
A standard feature: I take balls recovered in the final third (Wyscout) and add a weighted cherry on top in the form of forced turnovers leading to goals/chances. This add a bit of a purposeful touch.
INVOLVED IN ATTACKING OUTPUT
Source: Manually tracked
Weight: 100%
My full-season notes include any tangible danger created by a team — be it a goal scored (with 1 slot for the official assist, up to 3 slots for any other meaningful contribution in the build-up), or a goalscoring opportunity wasted (up to 2 chance-creating slots). As long as the player features as a creator or a finisher, he's considered involved. In the end, I take the % and see who was the most proactive ("out there") for his team. The range is quite wide — from 21.4% to 52.2% in 25/26.
SUCCESSFUL ON-BALL PRESSURES
Source: Driblab
Weight: 75%
Number of successful on-ball pressures (within 0-4 meters from the opponent) per 90 minutes.
OFF-BALL RUNS IN BEHIND
Source: Driblab
Weight: 75%
Forward runs that break into the last defensive line, getting between defenders and goalkeeper.
DEFENSIVE ACTIONS
Source: Wyscout.hudl.com
Weight: 50%
"A defensive duel, interception or a sliding tackle made by the player", normalized per 90 mins.
QUICK RECOVERIES
Source: Driblab
Weight: 50%
Recoveries 40+ meters from own goal made 8 seconds after losing the possession of the ball.
TACKLES/WAS DRIBBLED
Source: Driblab
Since forwards are not dribbled too much, and there would be a number of 100%s or 0%s after underdoing 1-3 duels, I am tracking this purely for my own information — and potential reference.
EXTREME ACCELERATIONS
Source: Driblab
Number of times that the player accelerates more than 3 m/s². This is purely off the ball.
(V) CLUTCH PERFORMANCE
GOAL INFLUENCE INDEX
Source: Manually tracked
A brother to the goal culpability index, this one is only relevant for attack-minded players. The index combines the player's involvement in goals scored with him around (ie. how often did he take up one of the 5 slots available per goal scored), and the goal scored per 90 mins rate with him on the pitch.
EXPECTED POINTS ADDED
Source: Manually tracked
Via all goals, only meaningful assists (ie. not just balls handed over to the lucky/sharp shooter at the edge of the box), and from 2025/26 onwards, also for any meaningful indirect goal contribution (at a lesser weight). Here's full explanation of the innovative model, initially introduced by CSfotbal.
For reference, here's the final leaderboard for 2025/26.
LUCK INDEX
Source: Own construct, riding on data from Wyscout.hudl.com
Instead of looking at actual goals and expected goals discrepancy to find "(un)lucky" finishers, as many fans or journalists do, I have designed a simple concept doing — in my humble opinion — a far better job in capturing the actual luck factor. Instead of (pre-shot) expected goals, I am taking (post-shot) expected goals scored into account, deducting non-penalty goals scored, while any woodwork hit counts as a minus-0.7 goal against expectations. Previously I considered a bar/post to be worth 1 full goal, which wasn't quite right, but it's obvious that the finisher comes pretty close to actually scoring by hitting it, so I still go rather high with my valuation — in the vicinity of a penalty shot.
TEAM GOAL INVOLVEMENT
Source: Manually tracked
A sub-metric of the goal influence index, I may sometimes isolate it to refer to the extreme.