Metrics contained in the glossary of terms are based on my manually tracked data, or raw Wyscout data.
Metrics marked by ★ are contained in both individual and comparison visuals, ☆ signals only the latter.
Some metrics, with no symbol, are only referred to as part of the various texts, without appearing on charts.
(I) RUDIMENTARY DEFENDING
VITAL SHOT BLOCKING
Source: Wyscout.hudl.com / Manually tracked (for blocks preventing tangible danger)
What's handy is that Wyscout tracks all kinds of blocked shots. What isn't so handy is that there is a rich variety in how much actual danger those are preventing. Much like with shots, blocks are not created equal, hence I am applying a co-efficient to extra credit those who block shots that are clearly goalbound and from dangerous positions; ie. vastly different from hopeful long-range attempts headed for easy suffocation. For this bonus to be applied, the player also needs to actively move into a position to block such a dangerous shot. While Wyscout counts even passive blocks with the player basically just standing in the shot's way, sometimes even facing away from the shooter, the co-efficient disregards these instances. That's why there was just one player going into the double digits with these vital blocks (Filip Čihák) in 24/25. You can be sure all of those 13 mattered.
SWEEPING ATTEMPTS AT THE BACK
Source: Manually tracked
Instead of relying on Wyscout's clearances (sometimes bizarrely tagged deep into the attacking half) or vague "successful defensive actions", I rely on my own set of eyes and track truly vital defensive actions by myself. For this metric, I look at one's balance in game-reading (successful interceptions versus only partial interceptions, mistimed jumps or cases of miscommunication) and pure damage control (vital clearances or cases of backtracking versus those missed ones). Since it's all about the balance, the top of the leaderboard isn't flooded by bottom feeders with the most opportunities to sweep up (while pinned) at the back. Even the likes of Filip Panák or Sampson Dweh rank pretty high.
AERIAL DUEL PROWESS
Source: Wyscout.hudl.com
Previously, I was only concerned about a centre backs's success rate in his own box, and those aerial duels are still (naturally) my primary concern. But from 24/25 onwards, I am also going to account for how the particular player fares inside the opponent's box (assigning half the value to this success rate; secondary in nature for a CB), ie. how much of a valuable aerial presence he offers overall.
SUCCESS IN DEEP DEFENSIVE DUELS
Source: Wyscout.hudl.com
To filter out noise that doesn't matter, I'm concerned purely with ground duel success rate in here.
(II) CONSISTENCY & DEPENDABILITY
FOULS IN DEFENSIVE THIRD
Source: Wyscout.hudl.com
Pretty straightforward; with an added co-efficient applied to bring out penalty fouls.
POSSESSION/DUEL LOSS LEADING TO SHOT
Source: Wyscout.hudl.com
This is an interesting metric in that it accounts for both misplaced passes and lost aerial or ground duels (with the former weighed more heavily due to more control). The follow-up shot needs to occur inside the next 20 seconds per Wyscout rules, otherwise it’s rendered a “harmless” loss.
TENDENCY TO SWITCH OFF ON DEFENCE
Source: Manually tracked
This is where I bash the player for any time he was caught sleeping; specifically whenever he caused a goal or a major chance via poor positioning, loose marking or lacking gap control (not applying pressure on a shooter/passer soon or urgently enough); a special co-efficient is applied on top of this to account for goal-causing errors. To be clear, I am no seasoned coach or even a tactics experts, so I might be off on a lot of these situation, but across the full season, I'd argue it evens out.
NET PERFORMANCE (+/-)
Source: Manually tracked
I have notes on all tangible danger occurring in each game, detailing culprits of all goals and chances allowed. For goals, these can be up to 4; for chances a maximum of 2. Similarly, any prevented threat gets assigned the "saviour". Once you put all starts together, how often does a centre back appear on the right side of the history? Given that there are more slots to go around for culprits rather than saviours, you might be surprised 11 of 61 regular CBs were at least break even. I normalize this per 90 mins, too, because being minus-2 on balance is not the same after 10 as it is after 30 games.
BLAME SHARE FOR GOALS CONCEDED
Source: Manually tracked
As previously noted, I assign up to 4 goal-allowing slots to any goal conceded across the season. There is one slot reserved for a grave fuck-up and three extra ones for more run-of-the-mill mistakes like losing a key aerial/ground duel, getting peeled off by a ball carrier, etc. This metric, contained in the comparison tables only, then speaks to how big a percentage of goals the centre back "caused" — only accounting for goals against he is, in fact, on the pitch for to be entirely fair.
(III) AWARENESS & DYNAMISM
SUCCESS IN LOOSE BALL DUELS
Source: Wyscout.hudl.com
As opposed to fullbacks, I am going with the success rate here to complement the aerial and ground duel success rates, to ultimately paint a full(ish) picture of one centre half's duel acumen.
POSSESSION-ADJUSTED INTERCEPTIONS
Source: Wyscout.hudl.com
Interceptions alone don’t tell the full story — if your team dominates possession, you barely get the chance to make any. Wyscout fixes that by normalizing for context: they assume every team spends an equal 30 minutes per game out of possession (based on a 60-minute average of actual ball-in-play time). That way, players from possession-heavy teams aren’t punished for simply doing their job — which is how guys like Holeš, Panák or Tekijaški still manage to land in the 75th–90th percentile.
CONTROLLED CLEARANCES
Source: Wyscout.hudl.com
This is one of my original innovations undergoing a bit of reconstruction in 2024, when I switched from the share-of-all approach, and instead simply look at the number of controlled clearances normalized per 90 minutes. As a refresher: a clearance is considered “controlled” when it results in the team in question retaining the possession post-clearance. Sometimes you can also see it called a “targeted header”, but I don’t only consider aerial clearances, mind. I’ve dropped the percentage because a lot of clearances are done in crowded, high-pressure areas inside the penalty box, and those facing more daunting tasks like these are unfairly punished. Now I believe my model does at least marginally better in trying to tell us a (partial) story of one’s awareness/peripheral vision.
METERS GAINED VIA RUNS WITH THE BALL
Source: Wyscout.hudl.com
This metric, normalized per 90 mins, measures how many meters a player advances the ball through successful carries, excluding passes. It calculates the difference in distance to the opponent's goal between the start and end point of a run or dribble, counting only forward movements.
(IV) BUILD-UP CONTRIBUTION & THREAT
NON-PENALTY EXPECTED GOALS
Source: Wyscout.hudl.com
Wyscout's approach to measuring threat generated. I used to consider both expected goals and assists in this space, but then I realized in 2025 that for creative passing/crossing, there are enough other metrics, so here I focus purely on the threat posed in the capacity of a finisher. Normally, this stat boils down to "who's the biggest set piece alfa", since the rare penalty takers like Ladislav Krejčí see a penalty filter applied for the sake of fair comparison. (He was still elite in racking up xG, duh.)
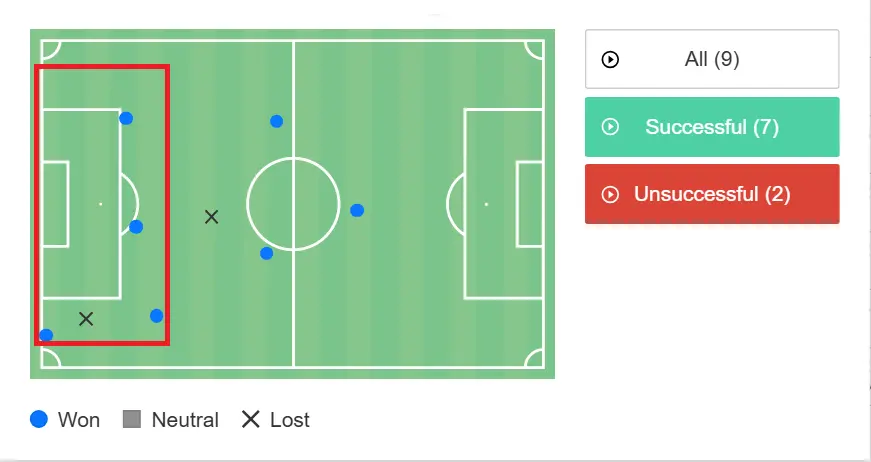
PENALTY AREA ENTRIES FROM OPEN PLAY
Source: Wyscout.hudl.com / manually tracked (for danger created via touch/feel for the game)
The number of times, normalized per 90 mins, a player enters the opposition’s penalty area in open play — via a carry, a cross, or a pass. It discounts set pieces for fair comparison. In addition, a co-efficient benefitting prolific chance/goal creators via superior touch and feel for the game is applied.
ACCURATE DIAGONAL SPREADS
Source: Wyscout.hudl.com
Sorting through tags, I filter out accurate long passes that stretch play more or less diagonally, hitting the channels, and take away any out-of-the-bounds stretch passes from the total. This metric is also normalized per 90 mins since being plus-4 means something else across 10 and 30 starts.
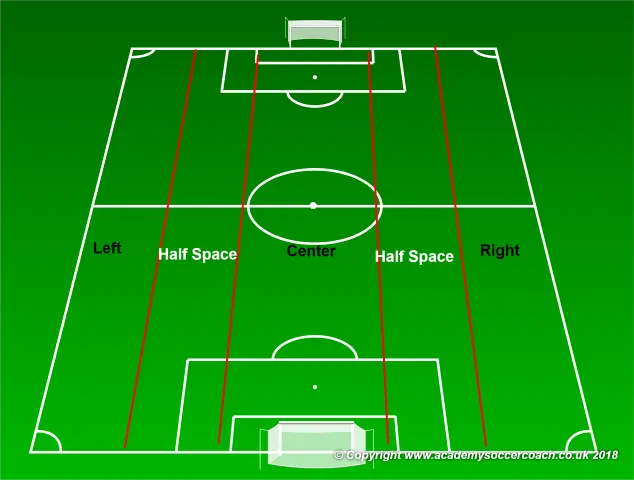
FORWARD PASSES FEEDING HALF SPACES
Source: Wyscout.hudl.com
Oh yes, your hipster friend’s term — of course it pops up. You always find the half-space here, and exploiting it is a noted weapon, so hitting them regularly is welcome. Also normalized per 90 mins.
DANGER CREATED PER 90
Source: Manually tracked
My own alternative to Wyscout's flawed xG/A, where I don't care for unfinished business. As long as the player delivers the ball to a dangerous position, onto his teammate's feet, he gets credited regardless of the outcome. Sometimes, if the teammate doesn't time his slide properly or wildly miscontrols the ball, the "on his teammate's feet" caveat doesn't apply, either. And with the exception of goals, the player can also be credited for creating danger for himself. As opposed to xA, I also disregard set piece delivery to make sure the comparison is fair and indeed feasible.
ADDED VALUE PER 90
Source: Manually tracked
Via all goals and only meaningful assists (ie. not just balls handed over to the lucky/sharp shooter at the edge of the box). Here's full explanation of the innovative model, initially introduced by CSfotbal.