Metrics contained in the glossary of terms are based on my manually tracked data, or raw Wyscout data.
Metrics marked by ★ are contained in both individual and comparison visuals, ☆ signals only the latter.
Some metrics, with no symbol, are only referred to as part of the various texts, without appearing on charts.
(I) DEFENSIVE RELIABILITY
VITAL DEFENSIVE CONTRIBUTION
Source: Manually tracked
Instead of relying on Wyscout's clearances (sometimes bizarrely tagged deep into the attacking half) or vague "successful defensive actions", I rely on my own set of eyes and track truly vital defensive actions by myself. For this metric, I combine interceptions, clearances and backtracking actions that actually prevent danger (ie. occur in a situation when, say, pass is directed to opponent's feet in a final third or thereabouts, not just anywhere). It is not just about racking up these, though, otherwise the top of the leaderboard would just be full of bottom-feeders; it's about the balance. Hence, the player in question is punished whenever he mistimes a jump, botches a clearance, only half-intercepts a situation, miscommunicates, or blatantly ignores his backtracking duties.
It's a lot, I'll admit, but a vast majority of 24/25 regular fullbacks (29) landed in the green.
DEFENDING THE CHANNEL 1-ON-1
Source: Wyscout.hudl.com
A metric designed to filter out noise that doesn't matter, I am concerned purely with ground duel success rate down both channels, stretching all the way to the half-line. Specifically, these areas.
TENDENCY TO SWITCH OFF ON DEFENCE
Source: Manually tracked
This is where I bash the player for any time he was caught sleeping; specifically whenever he caused a goal or a major chance via poor positioning, loose marking or lacking gap control (not applying pressure on a shooter/passer soon or urgently enough); a special co-efficient is applied on top of this to account for goal-causing errors. To be clear, I am no seasoned coach or even a tactics experts, so I might be off on a lot of these situation, but across the full season, I'd argue it evens out.
FOULS IN DEFENSIVE THIRD
Source: Wyscout.hudl.com
Pretty straightforward; with an added co-efficient applied to bring out penalty fouls.
CRUCIAL BACKSTOPPING ACTIONS
Source: Wyscout.hudl.com / manually tracked (for goal-preventing backstopping actions)
Every now and then, if it's a major aspect of one's game especially, I might refer to these backstopping actions that are actually all blocks (as registered by Wyscout) weighted against last-ditch blocks, interceptions or clearances that basically prevented a clear goal. These are rare, by the way, with Tekijaški and Čihák topping out at 5 among outfield players — as opposed to just any danger-preventing backstopping actions that are also included in "vital defensive contributions".
(II) PROACTIVITY & DYNAMISM
PRESSURE APPLIED UP HIGH
Source: Wyscout.hudl.com / manually tracked (forced high turnovers leading to tangible danger)
A standard feature: I take balls recovered in the final third (Wyscout) and add a weighted cherry on top in the form of forced turnovers leading to goals/chances. This add a bit of a purposeful touch.
LOOSE BALL DUELS WON
Source: Wyscout.hudl.com
As opposed to elsewhere, I am not too concerned with the success rate here; I simply want to see how many races — shoves and pulls — for a free ball in no one's possession the player in question successfully navigates per game. That, and only that, tells us something about his proactivity.
POSSESSION-ADJUSTED INTERCEPTIONS
Source: Wyscout.hudl.com
Interceptions alone don’t tell the full story — if your team dominates possession, you barely get the chance to make any. Wyscout fixes that by normalizing for context: they assume every team spends an equal 30 minutes per game out of possession (based on a 60-minute average of actual ball-in-play time). That way, players from possession-heavy teams aren’t punished for simply doing their job — which is how guys like Zelený or Diouf still manage to land in the 80th–100th percentile.
SUCCESS IN HIGH OFFENSIVE DUELS
Source: Wyscout.hudl.com / manually tracked (duels/fouls and dribbles leading to tangible danger)
Here, too, the emphasis is placed on the amount of offensive duels successfuly navigated in the final third (broadly) rather than success rate, to better capture one's proactivity; with an additional co-efficient applied to reward tangible danger (goals/chances) created via dribbles or duels/fouls won.
ACCELERATIONS
Source: Wyscout.hudl.com
This stat captures meaningful ball-carrying surges — defined as runs of at least 10 meters featuring a notable increase in speed. Only actions in possession count — pure off‑ball sprints do not.
(III) BUILD-UP CONTRIBUTION & THREAT
NON-PENALTY EXPECTED G+A
Source: Wyscout.hudl.com (heavily corrected via manual tracking)
Wyscout's approach to measuring threat generated. Mind that xA value is only assigned to a pass/cross that directly precedes a shot; any sort of a partial touch from the opponent along the way, or even a longer dribble/run with the ball from the finisher, normally leads to no xA. (Disclaimer: For the sake of pizza chart's compactness, xG+A are bulked together; for the sake of comparison tables and calculating the respective average percentiles, they are separate.)
METERS GAINED VIA BALL CARRIES
Source: Wyscout.hudl.com
This metric, normalized per 90 mins, measures how many meters a player advances the ball through successful carries, excluding passes. It calculates the difference in distance to the opponent's goal between the start and end point of a run or dribble, counting only forward movements.
METERS GAINED VIA PASSING PLAY
Source: Wyscout.hudl.com
This metric quantifies how much ground a player advances the ball through their passing, measuring the forward distance (toward the opponent’s goal) between the start and end points of each completed pass. It doesn't account for any lateral/backward movement, as per common sense.
OPEN-PLAY PENALTY BOX ENTRIES
Source: Wyscout.hudl.com
The number of times, normalized per 90 mins, a player enters the opposition’s penalty area in open play — via a carry, a cross, or a pass. It discounts set pieces for the sake of fair comparison.
DANGER CREATED PER 90
Source: Manually tracked
My own alternative to Wyscout's flawed xG/A, where I don't care for unfinished business. As long as the player delivers the ball to a dangerous position, onto his teammate's feet, he gets credited regardless of the outcome. Sometimes, if the teammate doesn't time his slide properly or wildly miscontrols the ball, the "on his teammate's feet" caveat doesn't apply, either. And with the exception of goals, the player can also be credited for creating danger for himself. As opposed to xA, I also disregard set piece delivery to make sure the comparison is fair and indeed feasible.
ADDED VALUE PER 90
Source: Manually tracked
Via all goals and only meaningful assists (ie. not just balls handed over to the lucky/sharp shooter at the edge of the box). Here's full explanation of the innovative model, initially introduced by CSfotbal.
(IV) PASSING RANGE & SMARTS
% OF CROSSES BLOCKED EARLY
Source: Wyscout.hudl.com
Even in the inverted wingback era, crossing remains a big part of one fullback’s game which is why most public models or databases include crossing accuracy. I myself had considered “accurate crosses to centre of the box” in 2021, but I quickly dropped it as a metric, and I’ll explain why: it’s too random. Is it necessarily the fullback’s fault when he delivers the ball into the danger area only for no one else to take a hint and make the run? It quite often is not. Is it, however, the fullback’s fault when his delivery gets blocked before it even enters the penalty area, potentially kick-starting a dangerous counter? It rather often is, yeah. So that’s what I’m looking at here. I don’t care if your cross doesn’t quite connect as long as it can feasibly lead to a lucky bounce or even an own goal in the end.
SUCCESS RATE IN ENTERING THE BOX
Source: Wyscout.hudl.com
When entering the box from open play, a fullback in particular should think a little, since they normally have vast acres of space to utilize. While the similar metric speaking to the no. of successful entries inherently favours players on big teams, enjoying loads of possession, this one does not.
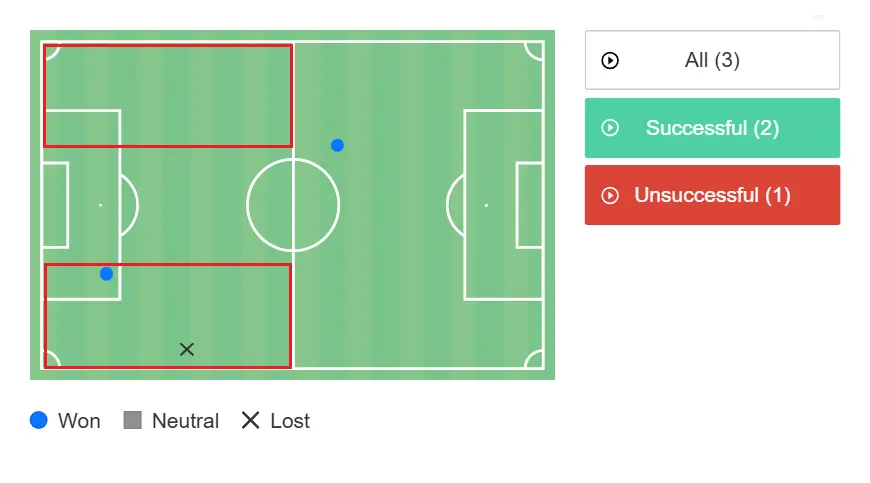
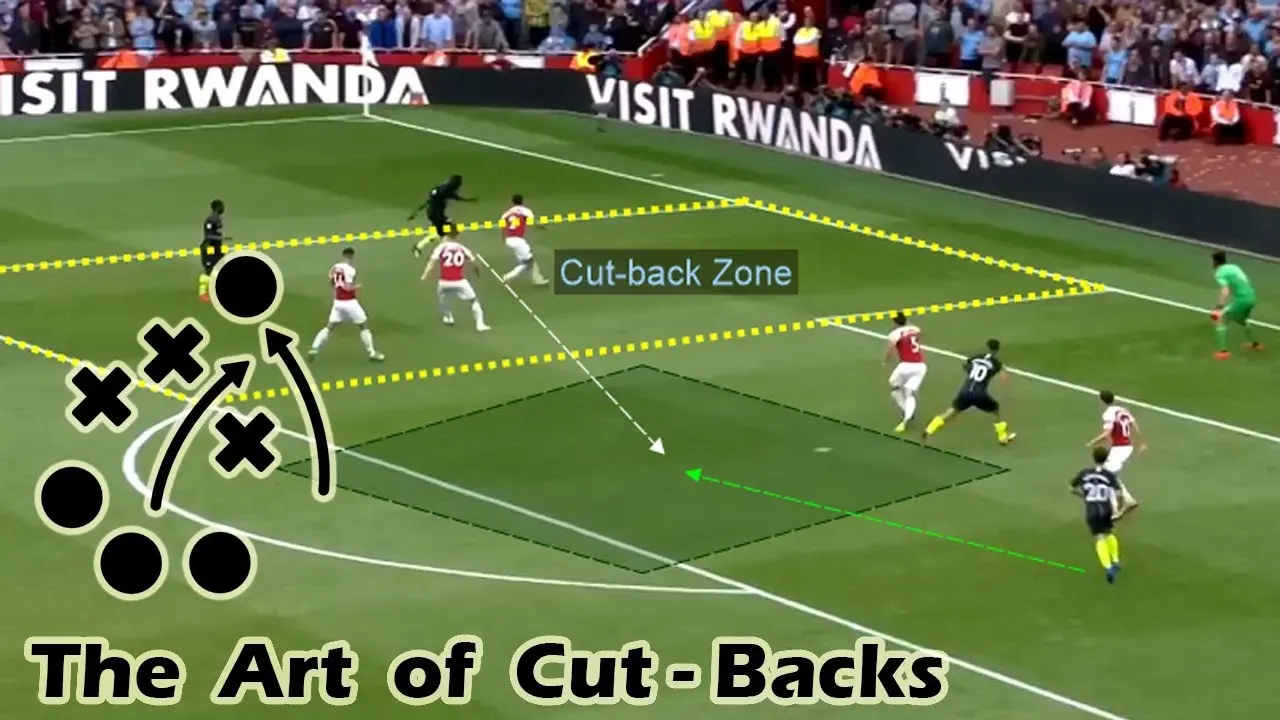
CUTBACKS IN DANGER AREAS
Source: Wyscout.hudl.com / manually tracked (for danger creation involving superior sense or touch)
Effectively forming one part of a half-space, the so-called “cutback zone” is another noted danger area of the pitch where you’d ideally want your modern fullback to function and cause damage. I don’t necessarily limit myself to cutbacks from inside the box only, but they do have to be directed to centre(ish) of the box to qualify. Players who often contribute to goals/chances via lay-offs, dummies or give-and-go's get extra credit here, to separate the wheat from the chaff so to speak.
HORIZONTAL & VERTICAL PASSING
Source: Wyscout.hudl.com
A combination of accurate long vertical passes and long horizontal ones, to create a full picture of one fullback's passing range. As for the vertical passes accounted for, they must occur inside the attacking half and must be push plays, daring plays — not just any forward passes. As for the horizontal passes accounted for, they must travel at least half of the pitch (in width), at least vaguely push the play forward — and whenever you send such a pass out of bounds, it offsets your total.