Metrics contained in the glossary of terms are based on my manually tracked data, or raw Wyscout data.
Metrics marked by ★ are contained in both individual and comparison visuals, ☆ signals only the latter.
Some metrics, with no symbol, are only referred to as part of the various texts, without appearing on charts.
(I) SHOT-STOPPING QUALITIES
PREVENTED GOALS
Source: Wyscout.hudl.com
A familiar concept by now. This metric incorporates what is commonly known as post-shot xG, usually shortened as xG² or xGC (expected goals conceded) — the younger of two xG methods that only considers shots on target (ie. shots that can actually turn into goals) and accounts for stuff like shot power and shot placement (ie. stuff the traditional xG method typically doesn’t consider). This post-shot xG then gets turned into the so-called “prevented goals” metric that follows the simple equation of expected goals conceded-minus-conceded goals, divided by the number of starts (to get a 90-minute average). Crucially, diverging from the catch-all Wyscout method, I’m not including penalties and don’t count own goals among goals conceded, giving the stat a fresh look that truly reflects one’s shot-stopping (whereas earlier it played in randomness’ favour more).
HIGH-DANGER SAVES
Source: Wyscout.hudl.com / manually tracked (1-on-1 situations)
This builds on the previous one in that it's based on expected goals conceded (xGC), but does include penalty saves for the benefit of the goalkeeper. Any shot that would — per xGC — result in a goal scored in at least 40% of cases (ie. value of 0.4+ xGC) is credited to the custodian as a high-danger save. As ever with arbitrary cut-offs, you could easily argue there’s no difference between 0.39 and 0.41 shots (and you’d be right) but we need an objective framework to complement our fundamentally subjective view of football and we wouldn’t be gaining anything by allowing for tolerance (a 0.02 xGC difference would be negligible at any point of the scale, so we'd be entering a deep rabbit hole either way). The shots warranting at least the 0.4 xGC value typically fall into the following categories: A. close-range stunner, B. mid-range diving save, or C. well-placed one-on-one.
(Disclaimer: Anecdotally speaking, the latter category is not as bloated as one would expect, since a botched one-on-one often includes a shot right into the goalkeeper's chest, rarely deserving a high xGC value. This way, the shooter isn't credited with a quality finish — see the expected goals scored metric for centre forwards — and that is arguably how it should be. However, to reward goalkeeper's positioning (often to blame for a one-on-one that indeed appears botched from a shooter's perspective), I track memorable one-on-one saves and dish out something of bonus points for them.)
HIGH-DANGER SITUATION SAVE %
Source: Wyscout.hudl.com
My own semi-scientific approach to the age-old “he doesn’t save anything extra” complaint about a goalkeeper — simply taking all 0.4+ xGC shots faced to see the proportion of goals conceded from hard and/or well-placed shots. Anyone who scores high here should have no trouble dodging the common complaint. Here, penalties are not considered for neither the trouble nor the benefit of the keeper in question. While the high-danger saves metric often boils down to opportunity, this one is a good complement where even a Slavia goalkeeper can rank high, as highlighted by Aleš Mandous of 23/24 appearing below average in hdSV/90 but comfortably elite (top 5) in hdSV%.
AVERAGE GOAL SHOT QUALITY
Source: Wyscout.hudl.com
Here I take a look at what’s the average xGC value of any non-penalty shot the particular goalkeeper faced across the season, and compare it against the average xGC value of all non-penalty attemps the said goalkeeper allowed to fly past him. With not a single exception in my time doing this, regular goalkeepers with 10+ starts allow goals of far higher average value than the usual shot (there’s always a bunch of easily saved long-range hopefuls bringing the overall average down), but the important question is how much higher. And it’s not like we’d be splitting hair, with the difference ranging from 0.17 to 0.31 last season, and from 0.14 to 0.36 this season. Last campaign was the first one with a pizza chart featuring this quirky metric, and 3/4s of the Top 4 easily stand the eye test: Antonín Kinský, Adam Zadražil and Jiří Letáček. Let us not speak of © The Outlier.
STOLEN x BOTCHED GAMES
Source: Wyscout.hudl.com
Anytime I use the term "stole" or "botched" a game, it has a scientific backing alright! In effect, it means the goalkeeper in question either saved (stole) or allowed (botched) a certain amount of expected goals conceded above (stole) or below (botched) reasonable expectation. Here, penalties and own goals come into consideration as opposed to the prevented goals metric, since it wouldn't feel right otherwise. The threshold for stolen/botched game is at plus or minus 0.81 xGC, ie. the value of one penalty kick. Don't ask me why I chose this inspiration in particular.
TOP-FLOP 100 EFFORTS
Source: Wyscout.hudl.com
Once again I take every single one of the goalkeeper's performances at face value (inclusive of penalties, own goals) and simply compare the number of times he fits into the Top 100 of goalkeeping performances (in terms of prevented goals) over the whole campaign, cut shorter by the number of times he conversely fits into the Worst 100 of goalkeeping performances. Just a bit of fun.
(II) CONSISTENCY & DEPENDABILITY
PREVENTED LONG-DISTANCE GOALS
Source: Wyscout.hudl.com
This one is obviously another xGC-based metric, but it falls into a different category simply because it speaks less to one's reflexes, and more to one's attention span. Otherwise it's exactly what it says on the tin: I consider exclusively the mid/long-range shots (outside the box) and do the classic xGC-GC.
LOSSES LEADING TO SHOT
Source: Wyscout.hudl.com
This is an interesting metric in that it accounts for both misplaced passes but also lost aerial or ground duels. The follow-up shot needs to occur inside the next 20 seconds per Wyscout rules, otherwise it’s rendered a “harmless” loss, which is yet another case of an arbitrary cut-off you can argue against, but it's about everything you can do about it. My bigger problem with this metric is: what if the loss is truly staggering and awful, yet the opposition is even worse and passes its way to a corner flag instead of shooting? Let’s assume it’s down to the goalkeeper’s psychic powers (and also we'll account for those shot-less cases further down the line, no worries).
SHARE OF GOALS CAUSED
Source: Manually tracked
This is where my subjective view comes to play for the first and decidedly not the last time, but since it’s me and only myself considering things all the time (with my lens that could be challenged but at least remain fairly consistent), I’d argue the subjectivity doesn’t cause too much actual harm. As for what it means: simply how big a portion of goals conceded I deemed to be the goalkeeper’s fault. And by fault I mean blatantly so. For example, I’m not setting the goalkeeper back for any seemingly flawed positioning on a shot, as I’m not the expert. But if he’s caught off position due to miscommunication with his defender? Oh he’s absolutely tagged. When he’s clearly slow to react, allows an easy tap-in unnecessarily, or sets up an empty-netter with a poorly timed rush off the line or misplaced pass, then he’s quite clearly at fault, as well. Previously, I also had a metric called “grave errors leading to goal” to double down on this, but since there’s always a few with 0, it didn’t make much sense to me anymore. Now it's just a garden variety of errors divided by all goals conceded (including penalty ones), with grave errors weighted differently — taken more seriously.
SHARE OF XCG UNDERPERFORMANCES
Source: Wyscout.hudl.com
I have dabbled with this kind of a thing before, but I always went about it the wrong way until settling on this version of a consistency metric for 23/24. Previously, I wanted to see overperformance rather than underpeformance, which inevitably disadvantaged those who didn’t face a single shot on occasion (when they had literally nothing to overperform and looked worse for it, an everyday worry of a Slavia goalkeeper nowadays). Now, I only consider full starts (no subs in or off) and compare the ratios of below-par (below zero) performances per prevented goals metric. I also briefly considered noting the so-called hot and cold streaks — strings of positive or negative performances, considering their respective extreme lengths, but since there would once again be little variety, I’m leaving it off the visuals entirely, with the odd mention in the text here and there.
SAVE & GOAL STREAKS
Source: Wyscout.hudl.com
Since I take note of all shots a goalkeeper faces across the season, I can easily pull the individual's hottest and coldest runs from my spreadsheet, specifically in terms of the most saves made in a row for the hot kind, and the most consecutive shots let past without making a single stop inbetween for the cold kind. Due to some spreadsheet functionality limits, a penalty save/goal always means a do-over for the count, but I'll make sure to note in the text if such a rare occurrence disturbs an otherwise particularly long hot/cold streak, no worries. It's hardly ever the case.
(III) SWEEPING & DISTRIBUTION
SUCCESS RATE WITH ACTIONS FAR OUTSIDE THE BOX
Source: Wyscout.hudl.com
The best, yet far from flawless data-entrenched representation of Neuer-like sweeping qualities I've come up with. By a “successful action” Wyscout means anything from a pass while building from the back to a clearance while intercepting a counter-attack, as long as possession is kept/regained for the team’s benefit. By “far outside the box”, I more or less mean the area of the pitch where a goalkeeper usually doesn’t tend to operate. (Disclaimer: I don’t consider anything happening inside the attacking half, since that usually suggests desperation mode towards the end of a losing game.)
BYLINE SPREAD CONSISTENCY
Source: Wyscout.hudl.com
More of a confidence-measuring stick, this one, as it looks at how often a keeper looks to spread the ball to the byline as part of the build-up (generally only considering balls directed to middle/final third, unless they are particularly long-range) and how consistent he is with this tactic. That means a plus point for an accurate spread, and a minus point for any such pass heading directly out of bounds (setting up an attacking throw-in for the opposition), divided by the number of full 90s.
MISPLACED PASSES INSIDE OWN HALF
Source: Wyscout.hudl.com / manually tracked (setting up chances/goals)
This metric not only accounts for any pass going to the sidelines, but also any ball that ends up at the opponent’s feet, as long as it finishes its journey inside the goalkeeper’s own half. Pretty straight-forward, until I start dishing out bonus minus points for a chance/goal set up that way. Which I do.
TARGETED FINAL THIRD PASSES
Source: Wyscout.hudl.com / manually tracked (contributions to goals/chances)
A brand new addition, and something of a return to my original "final third pass accuracy" metric. That had been dropped as it was too random, too reliant on the centre forward's aerial prowess. This one is only slightly less random and just as reliant, but it gives me an avenue to credit a goalkeeper who actually chips in to goals/chances the other way. I also strictly account only for the accurate final third passes (normalized per game) which actually target central areas clustered in/around box.
(IV) DAMAGE CONTROL
PUNCH/CLAIM RATIO
Source: Manually tracked
Previously in this space, I'd rely on Wyscout's "exit" metric which was supposed to capture any time a goalkeeper "leaves the line" to intercept (and decidedly didn't do it justice). So I decided to take it into my own hands and transition fully to a manually tracked metric. For the record, a punch worth the positive data entry must be performed under at least some semblance of pressure, and cannot allow for a juice rebound. If it does, it sets the goalkeeper back. My approach to claims is the same.
VITAL NON-SAVE INTERCEPTION
Source: Manually tracked
This admittedly sounds like a punch or a claim, but I'm nit-picky enough to distinguish in my notes. Very basically speaking, an "interception" is an intercepted pass, whereas a "claim" is an intercepted cross. There are some nuances, but the former normally involved anticipation to a far greater extent, so it speaks to a different quality timing your jump perfectly, holding onto a slippery/curly ball, etc. As an addition, this metric also accounts for the friendly fire instances where the goalkeeper never gets credited with a traditional save (as there was no "traditional" shot preceding it), and I find that deeply unfair. On the other hand, this isn't just a sum of all vital "non-save" interceptions, as I mercilessly deduct some points if the goalkeeper in question fails to make a routine save, doesn't communicate properly, or allows a juicy rebound through the fault of his own.
RUSHES FAR OUT OF THE GOAL
Source: Manually tracked
Another one based purely on my notes, but here I’m back to only taking one specific type of intervention into consideration — a rush all the way to the edge of the penalty area (or beyond) to prevent a chance from developing or getting finished, typically in a one-on-one situation. Again, if you perform this trick often while timing your rush poorly to actually facilitate a chance/goal on a decent number of your trips, you won’t be let off the hook completely.
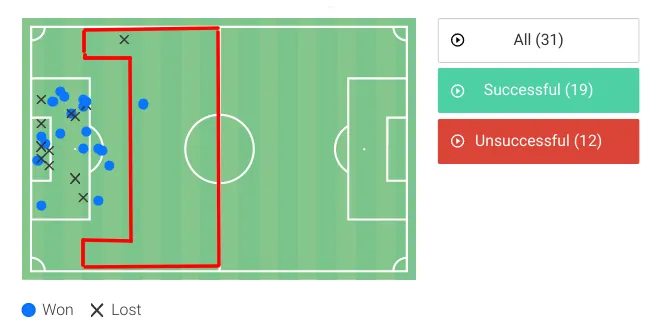
AERIAL DUEL SUCCESS RATE
Source: Wyscout.hudl.com
I’m only interested in success rate to not automatically punish goalkeepers who tend to be more cautious (but also consistent in their efforts). Simply put, when you do engage in an aerial duel, you’d better be 100% sure about it and, ultimately, 100% successful at it (hint: only about half of regulars are).